Summer 2026 in Europe was extremely hot
Summer 2026 in central/west Europe was insufferably hot. We have had Heatwave after heatwave. These have entered via France, bringing anomalously warm if not record-warm temperatures each time. We also had a major drought (see e.g. KNMI or WWA), with the Rhine and Danube at record low levels and many trees having turned to autumn colors already in late July.
Experiencing climate change like this got me thinking whether it relates to the more than doubled Earth Energy Imbalance and possibly accelerating global warming. That’s not a trivial question, but at least I can show just how extreme the 2026 summer was.
Update 8 September 2026: All plots are now updated with the full June, July, and August data. This adds one abnormally hot week and two relatively normal weeks to the plots. No major changes to the text were made.
Three figures to show how unusual 2026’s summer was
I’m basing the following three figures on the ERA5 reanalysis data (found here). There are some steps to the calculations and processing of the data, which you can find below in the Methodology section if you’re interested.
In short, I am taking the daily 2 m temperature maximum or the daily 850 hPa temperature mean as the main statistics. The 1991-2025 period is the reference climate, up until August 5, as this is the most recent date in the ERA5 reanalysis for 2026.
France has experienced the most anomalous weather
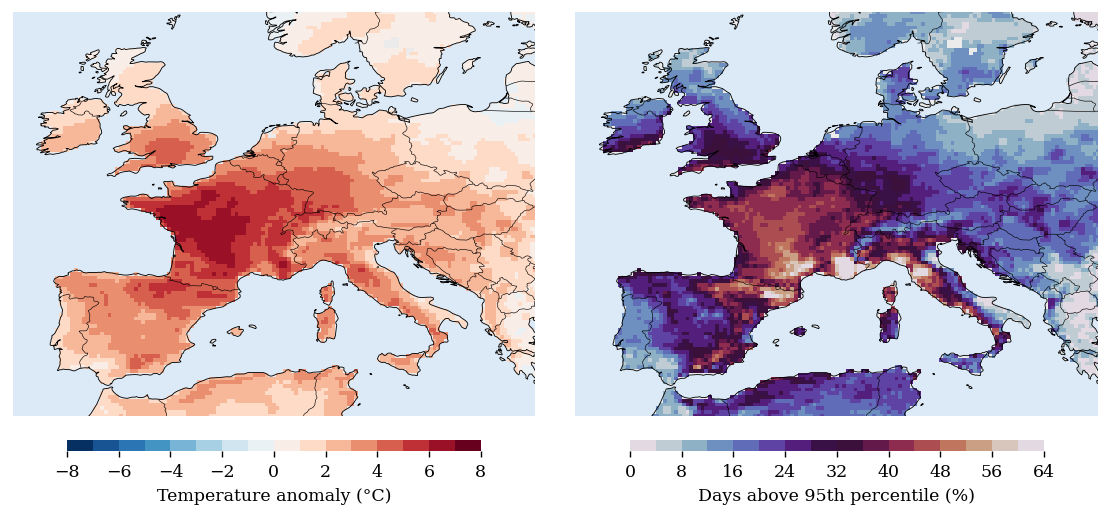
Most anomalously hot airmasses have entered via south-west Europe and become stationary over France and/or central Europe. When compared to the mean daily maximum temperature over the summer (until now), it’s mostly France where the anomalies have accumulated.
Mean temperature is not something we experience or remember most as humans. Rather, it’s the times it has felt unusually or unbearably hot. The statistic that better represents this is counting how many days the temperature was at the high end of the expected range based on climatology.
It is again France that shows up the most. Note that, by definition, we would expect to exceed the 95th percentile 5 % of the time, assuming our reference climate is representative of the present day. That assumption of course does not hold given a warming climate. But much of central Europe has exceeded the 95th percentile by far more than 5 %.
The mean airmass in central Europe has been record warm by (only) 1 C
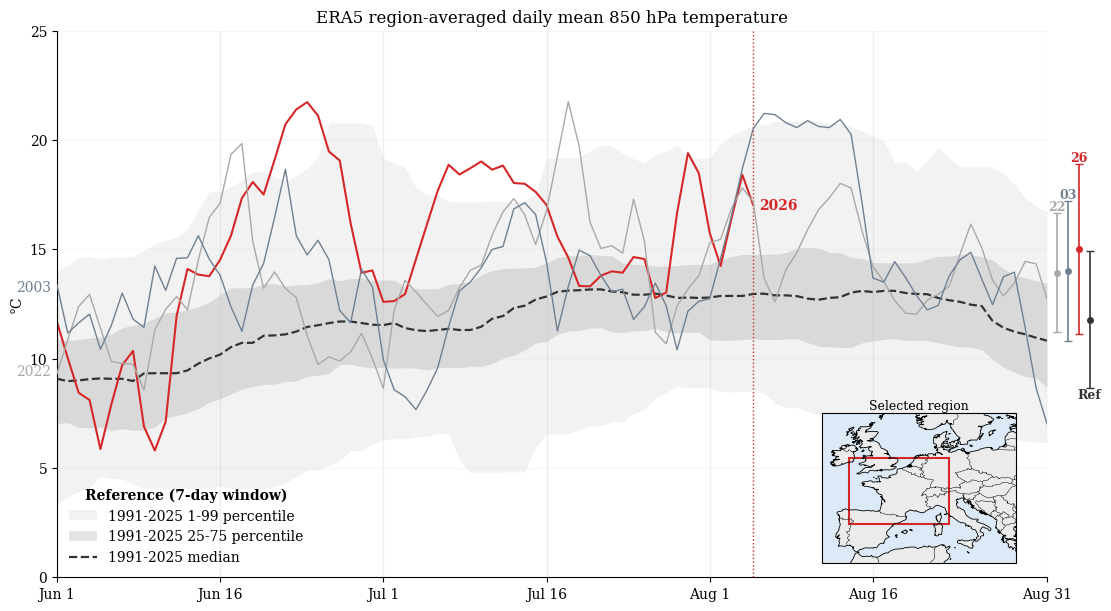
To understand whether this has happened before, and whether it was one big heat wave or several smaller ones, I made the plot below. It is based on daily mean 850 hPa, more representative of the airmass and less sensitive to variable surface conditions than 2 m temperature. This shows at least two interesting things:
- weather is highly variable
- the mean temperature of 2026 is not much higher than previous record years
(This figure looks qualitatively the same for daily 2 m temperature maxima as for the 850 hPa daily mean)
Summer 2026 is an extreme outlier
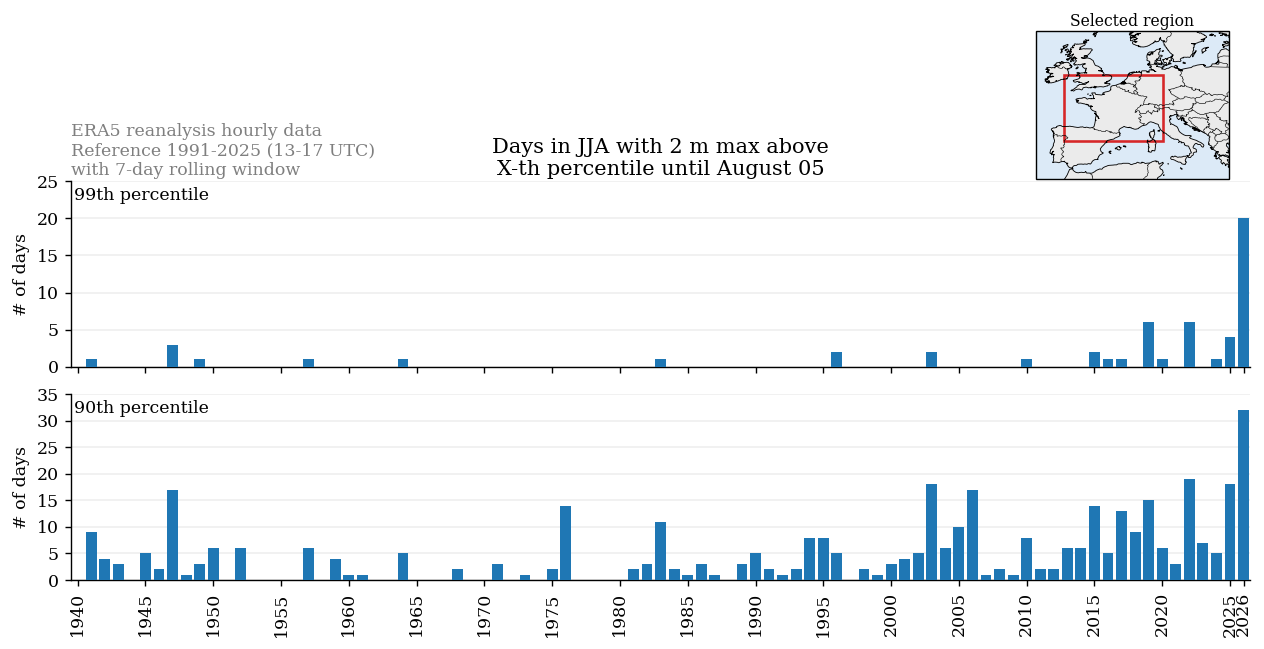
Clearly, summers close to as hot as 2026’s have been seen before. But a 1 degree shift in mean temperature can mean a lot for how extreme we perceive the weather, especially when we’re, due to climate change, experiencing previously unseen conditions.
I think this is greatly illustrated by counting the days where the 90th and 99th percentiles of temperature are exceeded. Now, 2026 is the most extreme outlier in our modern temperature records.
(Bonus) For Austria, this is already the new normal
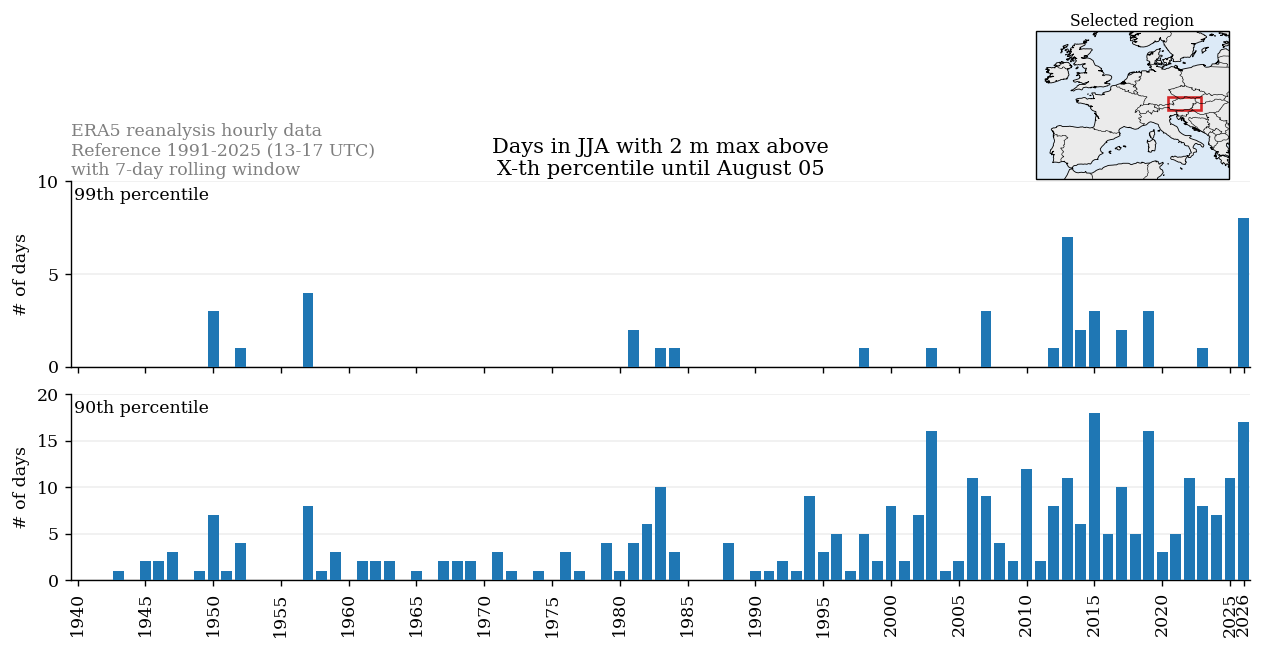
Zooming in on eastern Austria, where I spent more days with 40 C (or nights with minima above 20 C) than I could have imagined were possible, we can see that this summer is similar to many in the previous 20 years (based on 90th percentile exceedances). The difference this year was breaking all-time records, multiple times, despite the mean temperature not deviating much (not shown).
This is all supported by ground-based observations and climate records tracked by the national weather service here, see GeoSphere climate portal.
Methodology details
Data downloaded from Copernicus. The following steps were taken in gathering these statistics, in addition to those mentioned in the post above:
- 850 hPa daily mean is based on the 0, 6, 12, and 18 UTC time steps
- 2 m daily max is based on the 13, 14, 15, 16, and 17 UTC time steps
- Sea was masked out using the land sea mask file (
lsm > 0.5included). This does not change anything for 850 hPa statistics, but the record hot Mediterranean was polluting the 2 m data a bit. - All region-averaged statistics are of course area weighted using latitude
- The percentile thresholds are based on rolling 7-day means due to noisy statistics on a daily basis, even with a 35-year period. First the rolling window is applied, then the percentiles are extracted (instead of vice versa). The first and last days of the record thus have fewer data points for percentile calculations.
- No moving window is used for the map plot of 95th percentile exceedances
- All done in Python, with xarray, cartopy, cfgrib, and matplotlib as the main modules.
Feel free to reach out if you think I made a mistake or have questions / suggestions. Thanks for Christoph Riess for reviewing (many iterations) of the plots and this text.